The Tomoku Group expressed its support for the TCFD in May 2022 and has disclosed information in line with the TCFD recommendations since then. We recognize climate change as one of the most pressing global environmental challenges and understand that it can have a significant impact on the global economy and society.
The Tomoku Group regards climate change as one of its key management issues and is promoting the reduction of greenhouse gas emissions and the efficient use of energy. We will continue to actively disclose information on the Group’s climate-related strategies and initiatives and further enhance both the quality and quantity of our disclosures.
1. Governance
The President and Representative Director is responsible for the Group’s overall sustainability strategy, including its response to climate change.
The Sustainability Committee is chaired by the President and composed of the directors who head the Sales, Administration, and Production Divisions, as well as the head of Safety Promotion and Quality Assurance. As a rule, the Committee meets twice a year to formulate sustainability policies, discuss initiatives, set targets, manage progress, and report to the Board of Directors. The Board receives reports from the Sustainability Committee and monitors and oversees the status of the Group’s responses to key issues and target achievement.
Under the Sustainability Committee, the Company has established the TCFD Disclosure Project Team ("TCFD Disclosure PT"), led by the President, as well as the Sustainability Strategy Project Team ("Sustainability PT") and the Group Sustainability Liaison Meeting, both led by the head of the Administration Division (Figure 1).
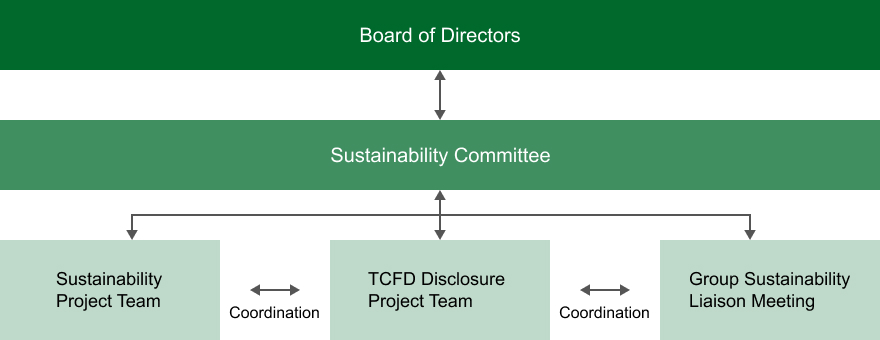 Figure 1. Governance
The TCFD Disclosure PT is supported by the ESG Promotion Office, the President’s Office, and the Quality Assurance Department, and is composed of the heads of the Corrugated Container and Display Carton Business, Housing Business, and Transportation and Logistics Business. The team discusses climate-related risks and opportunities, as well as response measures, taking into account each business’s characteristics.
The Sustainability PT is supported by the President’s Office and the ESG Promotion Office and is composed of the heads of the Sales, Administration, Production, and Quality Assurance Divisions. The team discusses and formulates various measures and policies to address sustainability issues.
The Group Sustainability Liaison Meeting is supported by the President’s Office and the ESG Promotion Office, and comprises executives from the core companies in the Housing Business and the Transportation and Logistics Business. In coordination with both Project Teams, the Meeting discusses Group-wide sustainability issues and responses to climate change, works to align the Group’s direction, and provides guidance and advice to Group companies.
Both project teams and the Group Sustainability Liaison Meeting work together to submit proposals to the Sustainability Committee, which reviews the proposals.
2. Strategy
2-1 Materiality
The Tomoku Group assesses issues from the perspectives of their impact on stakeholders and on the Group and identifies its materiality based on this assessment (Figure 2). Climate change has been identified as a key component of the Group's materiality, and efforts to address it are being promoted across the Group.
2-2 Scope of the Analysis
The Group’s scenario analysis covers consolidated companies in its three core domestic businesses—the Corrugated Container and Display Carton Business, Housing Business, and Transportation and Logistics Business—as well as its overseas consolidated companies. Net sales and operating profit by business for FY2025 are shown in Figure 3.
| Business in Scope |
- the Corrugated Container and Display Carton Business (Tomoku non-consolidated and 9 consolidated subsidiaries)
- Housing Business (4 consolidated subsidiaries)
- Transportation and Logistics Business (4 consolidated subsidiaries)
- Overseas (3 consolidated subsidiaries)
|
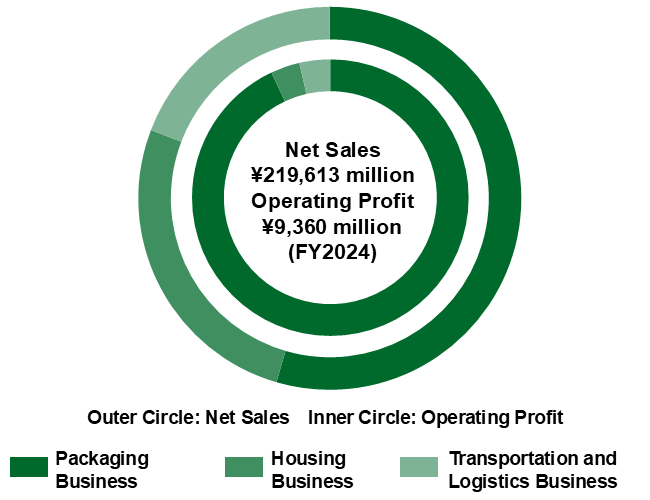 Figure 3. Net Sales and Operating Profit by Business Segment
2-3 Climate-related Scenarios
In our scenario analysis, we referred to materials published by the International Energy Agency (IEA) and the Intergovernmental Panel on Climate Change (IPCC) and developed the 1.5°C and 4°C climate change scenarios shown in Table 1.
We will continue to incorporate the latest data and insights, enhance the accuracy of our scenario analyses, and integrate the findings into our management strategy to strengthen the Group’s resilience to future uncertainties.
Note: If data are unavailable for the 1.5°C scenario, the 2°C scenario is used.
Table 1. Scenario Definitions
Notes:
- IEA World Energy Outlook (WEO) 2025 was referenced for the estimation and assessment of transition risks and opportunities, while WEO 2019 was used for electricity price projections.
- IPCC AR5 and AR6 were referenced for the estimation and assessment of physical risks.
2-4 Risks, Opportunities, and Strategies
We identified potential risks and opportunities and qualitatively assessed the magnitude of their impact as high, medium, or low. Transition risks and opportunities were assessed based on the 1.5°C scenario, which is expected to have a significant impact, while physical risks and opportunities were assessed based on the 4°C scenario. Based on the results of these analyses, our strategies for each risk and opportunity, together with the expected timing of their emergence, are summarized in Tables 2 and 3.
2-4 Risks, Opportunities, and Strategies
Table 3. Physical Risks, Opportunities, and Strategies (Primarily Based on the 4°C Scenario)
Notes:
-
Assessment Criteria for Impact
Qualitative assessment:
High: The business may be suspended or experience a significant reduction or expansion in operations.
Medium: Certain parts of the business may be affected.
Low: The impact is minor and is expected to have little effect on the business.
-
Time Horizon
Short term: Up to approximately three years from the present
Medium term: Through FY2030 (the target year for greenhouse gas emissions reduction)
Long term: Through FY2050
-
Business Classification
All: Common to Three Businesses
Pkg: Corrugated Container and Display Carton Business
T&L: Transportation and Logistics Business
Hsg: Housing Business
2-5 Financial Impact Assessment
We estimated and assessed the impact of climate change-related business risks on the Tomoku Group in terms of the potential increase or decrease in FY2025 operating profit.
For transition risks, we assessed quantifiable items such as carbon taxes, fossil fuel prices, and electricity prices. For physical risks, we assessed flood and storm-surge damage, as well as business interruption.
The reference materials and estimation methods used in the assessment are shown in Table 4, and the parameters used in the estimates are shown in Table 5.
Table 4. Reference Materials and Estimation Methods for Transition and Physical Risks
Notes:
- International Energy Agency, World Energy Outlook. The exchange rate used was ¥149.52/USD, based on the Tomoku Group’s FY2025 financial results.
- Damage amounts were estimated as annual average
| Carbon Taxes |
The parameters described in IEA WEO 20251 were used as reference. As WEO 2025 does not provide parameters for 2030, which is the target year of the Group's emissions reduction target, the parameters for 2035 were used as a proxy for 2030.
Impact of carbon tax introduction = (Scope 1 and Scope 2 emissions in FY2025 × baseline carbon tax rate) − (Scope 1 and Scope 2 emissions under each future scenario × carbon tax rate under each future scenario) |
| Fossil Fuel Prices |
Prices for city gas, diesel fuel, A-heavy fuel oil, LPG, gasoline, and other fossil fuels were estimated using the crude oil and natural gas price assumptions presented in IEA WEO 20251. For 2030, estimates were developed where feasible, otherwise, the 2035 parameters were used as a proxy, in line with the carbon tax analysis.
Fossil fuel cost = Fossil fuel consumption × Fossil fuel price
Impact of fossil fuel price changes = (Base-year fossil fuel cost) − (Fossil fuel cost under each future scenario) |
| Electricity Price |
Electricity prices were estimated using the projected changes in electricity prices between 2018 and 2030 presented in IEA WEO 20191. For 2050, the 2040 price was used as a proxy. As no electricity price projections were available for Vietnam, the corresponding values for China were used as a proxy.
Electricity cost = Electricity consumption × Electricity price
Impact of electricity price changes = (Estimated FY2025 electricity cost) − (Electricity cost under each future scenario) |
| Flood Damage2 |
The FY2025 actual value of assets, inventory assets, and building assets per employee for the Tomoku Group’s consolidated companies was calculated and allocated to each site.
Flood impacts were assessed using the maximum flood inundation depth identified from the Ministry of Land, Infrastructure, Transport and Tourism’s (MLIT) "Tsunami Hazard Maps" and "Overlapping Hazard Maps" (as of May 2025). Damage ratios were derived from the "Manual for Economic Evaluation of Flood Control Projects" (April 2020 draft), building damage ratios from the "Guidance for Physical Risk Assessment under the TCFD Recommendations," and annual exceedance probabilities from the "Technical Standards and Guidelines for River and Sabo Planning." These parameters were used to estimate flood damage.
For overseas sites, risk exposure was analyzed using the WRI Aqueduct Water Risk Atlas and Aqueduct Floods Hazard Maps.
・Flood occurrence frequency was estimated with reference to MLIT’s "Recommendations on Flood Control Planning under Climate Change," "Approaches to Flood Risk Management under Climate Change," and the IPCC AR6. The analysis assumes that the increase in flood frequency is proportional to the increase in average temperature relative to the end of the 20th century.
・Average annual flood damage = Asset value at each site × Damage ratio based on inundation depth × Floor-level adjustment factor × Annual exceedance probability
・Impact of flood damage = Total average annual flood damage across all sites × Flood occurrence multiplier (Baseline-year occurrence multiplier − Occurrence multiplier under each future scenario)
|
| Business Interruption2 |
The FY2025 actual value added per employee per day for each Tomoku Group consolidated company was calculated.
In the same manner as the flood damage assessment, suspension and stagnation periods were determined based on flood inundation depth and the MLIT's "Manual for Economic Evaluation of Flood Control Projects" (Draft, April 2020), and the associated losses were estimated.
・Average annual business interruption loss = Value added at each site × (Business interruption days + Stagnation days / 2) × Annual exceedance probability of flood events
・Impact of business interruption = Total average annual business interruption loss across all sites × (Baseline-year flood occurrence multiplier − Flood occurrence multiplier under each future scenario)
|
| Storm Surge Damage2 |
The likelihood of storm surge risk was analyzed using the WRI Aqueduct Water Risk Atlas and Aqueduct Floods Hazard Maps. Damage estimates were calculated based on the "Guidelines for Cost-Benefit Analysis of Coastal Projects (Revised Edition)" published by the Ministry of Land, Infrastructure, Transport and Tourism (MLIT) and the Ministry of Agriculture, Forestry and Fisheries (MAFF).
・The storm surge occurrence multiplier was estimated with reference to the Ministry of the Environment’s "Recommendations for Developing Management Strategies Using TCFD," IPCC AR5, and IPCC AR6. The analysis assumes that the increase in typhoon occurrence frequency (used as a proxy for storm surge occurrence) is proportional to the increase in average temperature relative to the end of the 20th century.
・Average annual storm surge damage = Asset value at each site × Damage ratio based on inundation depth × Floor-level adjustment factor × Annual exceedance probability
・Impact of storm surge damage = Total average annual storm surge damage across all sites × Storm surge occurrence multiplier (Baseline-year occurrence multiplier − Occurrence multiplier under each future scenario)
|
Table 5. Parameters Used to Estimate Transition and Physical Risks
Financial Impact Analysis by Scenario
We applied the 2030 and 2050 scenarios to FY2025 actual results for operating profit, fossil fuel consumption, electricity consumption, depreciable assets, inventories, and building assets to estimate the financial impact of climate change risks.
GHG Emissions Reduction Targets Assumed in the Analysis
Note: Opportunities and strategies shown in Tables 2 and 3 are not reflected in the estimates because they are difficult to quantify.
| Corrugated Container and Display Carton Business |
The Business aims to reduce its combined Scope 1 and 2 greenhouse gas emissions by 50% from FY2013 levels by 2030 through a complete transition to renewable electricity and environmental measures for boilers and onsite work lifts. |
| Transportation and Logistics Business |
The Business aims to switch entirely to renewable electricity by 2030. |
| Housing Business |
The Business aims to switch entirely to renewable electricity by 2030. |
As the emissions reduction target for 2050 is currently being developed, this analysis assumes that emissions in 2050 will remain at the level achieved after the 2030 target is met.
The financial impact after achieving the target was added to the financial impact before achieving the target, and the estimated results for the three businesses combined are shown in Figure 4 for the 1.5°C scenario and Figure 5 for the 4°C scenario.
Figure 4. Financial Impact Assessment for the Three Businesses Combined (1.5°C Scenario)
Under the 1.5°C scenario, the impact of government-imposed carbon taxes is expected to be particularly significant. Even if the established emissions reduction targets are achieved, the financial impact is estimated at approximately ¥1.89 billion in 2030 and ¥2.69 billion in 2050. The impact of carbon taxes is expected to be relatively large in the Transportation and Logistics Business and the Corrugated Container and Display Carton Business, both of which consume substantial amounts of fossil fuels.
Figure 5. Financial Impact Assessment for the Three Businesses Combined (4°C Scenario)
Under the 4°C scenario, the impact of flood and storm surge damage, as well as business interruption due to flooding, is expected to be significant. The financial impact is estimated at approximately ¥300 million in 2030 and ¥590 million in 2050.
In addition, the impact of higher fossil fuel costs is expected to become significant in 2050.
The sites assessed for flood and storm surge damage cover nearly all of the Group’s major sites and include 39 domestic and 2 overseas sites in the Corrugated Container and Display Carton Business, 79 domestic sites in the Transportation and Logistics Business, and 104 domestic and 1 overseas site in the Housing Business.
Of these, 31 key production sites, warehouses, and distribution centers are expected to experience inundation depths of 3 meters or more, approximately reaching the second-floor level of a typical house. These include 14 sites in the domestic Corrugated Container and Display Carton Business, 15 in the domestic Transportation and Logistics Business, and 2 in the domestic Housing Business, representing an increase from last year’s estimate.
These 31 sites have been identified as requiring particular attention, and we will further strengthen risk management at these sites, including through BCP measures.
2-6 Strategy Summary
Transition Risks and Opportunities
Risks
Under the 1.5°C scenarios for 2030 and 2050, the introduction of carbon tax policies could impose additional costs on the Corrugated Container and Display Carton Business, which uses fossil fuels as boiler fuel, and the Transportation and Logistics Business, which uses fossil fuels as truck fuel.
The primary measure to address this risk is to reduce greenhouse gas (GHG) emissions from business activities.
In the short term, we will continue to reduce this risk through measures that can be implemented now, including switching to renewable electricity, converting onsite lighting to LED, electrifying onsite work lifts, improving truck fuel efficiency and loaded vehicle rates, and introducing high-efficiency boilers.
In the medium to long term, at production sites where such measures have yet to be implemented, we will switch boiler fuel from heavy oil to city gas, which generates lower GHG emissions, and consider the use of biofuels. We will also plan new investments and implement measures in phases, taking into account the development and adoption of decarbonization technologies and infrastructure, including next-generation boilers and trucks powered by green hydrogen. In addition, for GHG emissions that are difficult to reduce, we will consider the use of carbon credits to offset such emissions.
Opportunities
In the Corrugated Container and Display Carton Business, the tightening of regulations on plastics is expected to create opportunities for increased demand for corrugated container and display carton as recyclable, environmentally friendly alternatives to plastic.
In the Housing Business, the growing demand for highly insulated and airtight homes that reduce energy consumption is expected to create opportunities for expansion in this market.
To capture these opportunities, we will promote design enhancements and technological innovation across each business, while strengthening our capabilities to provide environmentally friendly products and services.
Physical Risks and Opportunities
Risks
Under the 4°C scenario for 2050, the intensification of extreme weather events is expected to increase the frequency of natural disasters. This poses risks across all businesses, including damage to production and construction sites, disruptions to supply chains and lifelines, and impacts on employees from natural disasters, which may lead to temporary suspensions of production and business activities, as well as delays in deliveries and construction schedules.
In addition, a chronic rise in average temperatures increases the risk of worsening working conditions and declining productivity. To reduce these risks, we will strengthen our business continuity framework by reinforcing production and logistics backup systems, diversifying our supply chains, ensuring employee safety, improving working environments, and enhancing employee safety confirmation systems.
Opportunities
In the Corrugated Container and Display Packaging Business and the Transportation and Logistics Business, the increasing frequency of extreme weather events could drive increased demand for delivery services, beverages, and disaster-related products.
In the Housing Business, demand is expected to increase for highly insulated and airtight homes that reduce energy consumption even as temperatures rise, creating opportunities for market expansion.
To capitalize on these opportunities, we will strengthen our product and service development capabilities across our businesses and pursue high-value-added business initiatives that address changing environmental conditions.
3. Risk Management
Regarding climate change-related risks, the TCFD Disclosure PT, taking into account advice from consultants, identifies risks across the Group, assesses their financial impacts, and considers necessary measures.
Material climate change-related risks that are considered a high priority for the Group or have the potential to significantly impact the Group are jointly analyzed by the TCFD Disclosure PT and the Sustainability PT and reported to the Sustainability Committee. The Sustainability Committee deliberates on policies for addressing these risks and reports to the Board of Directors.
The President and Representative Director is responsible for overall risk management across the Group. Important risk management policies and revisions to such policies are deliberated and decided by the Board of Directors.
Sustainability-related risks, including climate change risks, assessed by the TCFD Disclosure PT and the Sustainability PT are communicated to Group companies through the Sustainability PT and the Group Sustainability Liaison Meeting, with each company requested to formulate and implement appropriate measures. The Sustainability Committee receives reports from the Sustainability PT and monitors and manages progress (Figure 6).
4. Metrics and Targets
The Tomoku Group uses greenhouse gas emissions (Scope 1 and Scope 2 combined) as a key metric in addressing climate change, one of its key management issues, and has set targets to reduce these emissions.
In light of Japan’s new Nationally Determined Contribution (NDC), submitted to the United Nations in February 2025, the Group will develop its medium- to long-term targets. In the short term, we will continue to implement measures that are currently feasible, such as introducing renewable electricity, converting fuels, improving fuel efficiency, and installing energy-efficient equipment, to steadily reduce emissions. Our near-term roadmap is shown in Table 6.
| GHG emissions reduction targets |
50% reduction by FY2030 compared with FY2013 levels (Scope 1 and 2 combined) |
| Share of electricity from renewable energy sources |
100% by FY2030 |
Table 6. Roadmap to FY2030 for the Three Domestic Businesses
For overseas operations, we will consider introducing electricity from renewable energy in Vietnam, excluding Sweden, where renewable energy is already widely used.
FY2025 Results
Greenhouse gas emissions (Scope 1 and 2 combined) in FY2025 were approximately 26% lower than in FY2013 (Figure 7).
A major factor contributing to the year-on-year reduction was the switch to electricity derived from renewable energy sources for Scope 2 emissions at Group companies in Corrugated Container and Display Carton Business and the Transportation and Logistics Business. Going forward, we will promote the use of electricity from renewable energy sources at overseas Group companies while also working to reduce fossil-fuel-derived Scope 1 emissions.
However, as the latest decarbonization technologies are not yet widely available, it is currently difficult to achieve an immediate and significant reduction in Scope 1 emissions.
We will therefore make the most of currently available resources and technologies by further improving equipment and operational efficiency, promoting greater awareness of resource conservation in daily operations, and enhancing regular equipment maintenance. We will also continue to gather information on technological advances and the potential adoption of new solutions and respond flexibly as circumstances evolve.
Figure 7. Tomoku Group Greenhouse Gas Emissions (Scope 1 and 2)
At this stage, the widespread adoption of advanced decarbonization technologies remains limited, making substantial near-term reductions difficult. However, we will continue to promote initiatives that make the most of existing resources and technologies, including further improvements in equipment and operation efficiency, greater awareness of resource conservation in day-to-day operations, and stronger preventive maintenance of facilities and equipment. We will also continue to monitor technological advances and newly available solutions and respond flexibly as circumstances evolve.
Total supply chain emissions (Scope 1, 2, and 3) for FY2025 amounted to approximately 1,042.7 thousand tons (Figure 81). Scope 3 accounts for approximately 93% of total emissions, with Category 1 (Purchased goods and services) representing about 71% and Category 11 (Use of sold products) about 14%.
Category 1 consists mainly of emissions associated with containerboard, the primary raw material used in the Corrugated Container and Display Carton Business. Category 11, on the other hand, consists mainly of emissions from the use of homes sold in the Housing Business.
While Scope 3 emissions have been trending downward overall due to an increase in Category 2 and a decrease in Category 11, Category 1 remained largely unchanged in FY2025 (Figure 9).1
For containerboard, IDEA Ver. 22 was used in FY2021; data published by the Japan Paper Association3 in FY2022; and from FY2023 onward, a combination of primary data on containerboard purchased by Tomoku on a non-consolidated basis and data published by the Japan Paper Association3 has been used.
The same approach was used in FY2025. Going forward, we will work to expand the collection of primary data to calculate emissions more accurately, while strengthening collaboration with our business partners to deepen their understanding of greenhouse gas emissions reduction.
The high proportion of Category 11 (Use of sold products) is attributable to Sweden House, the flagship brand of the Group’s Housing Business, which offers high energy efficiency, with primary energy consumption well below the energy efficiency standard, as well as exceptional durability, with a service life of 90 years, far exceeding that of ordinary homes. We will continue to promote the design of homes with low BEI (Building Energy Index) values (0.55 in FY2025) and work to reduce emissions during the use phase of homes.
Notes:
- The Tomoku Group’s greenhouse gas emissions include consolidated companies as well as non-consolidated companies that meet criteria equivalent to the operational control approach under the GHG Protocol. Emissions for prior fiscal years may be revised due to business acquisitions and other changes.
- Sustainable Management Promotion Organization
- Japan Paper Association, CO₂ Emissions over the Life Cycle of Containerboard, February 20, 2023
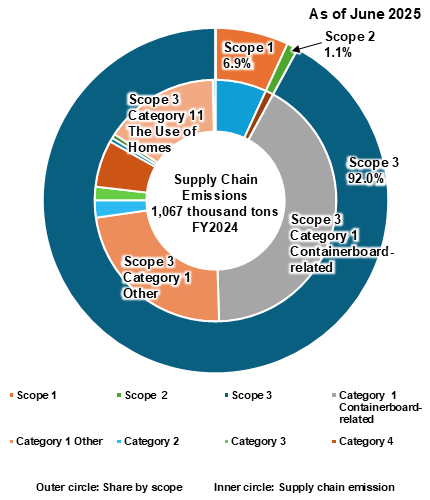 Figure 81. Tomoku Group Supply Chain Emissions
(Scope 1, 2, and 3)
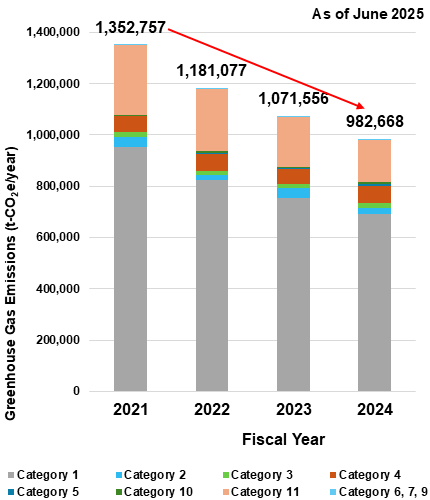 Figure 91. Tomoku Group Greenhouse Gas Emissions (Scope 3)